Google Ads Architectural Analysis: Dissecting The 2.22% CTR and $16.00 CPA Landscape
The Google Ads platform is undergoing a significant architectural shift, driven by advancements in campaign formats like Demand Gen and Performance Max, coupled with fundamental changes in user search interaction. A comprehensive Q1 2026 benchmark dataset, comprising over 21,000 active accounts, provides a clear technical readout of how these systemic changes manifest in campaign performance metrics. While top-line indicators appear stable, a forensic analysis reveals a critical redistribution of conversion pathways and performance attribution.
Google Ads Performance Metrics: Engagement Versus Efficiency
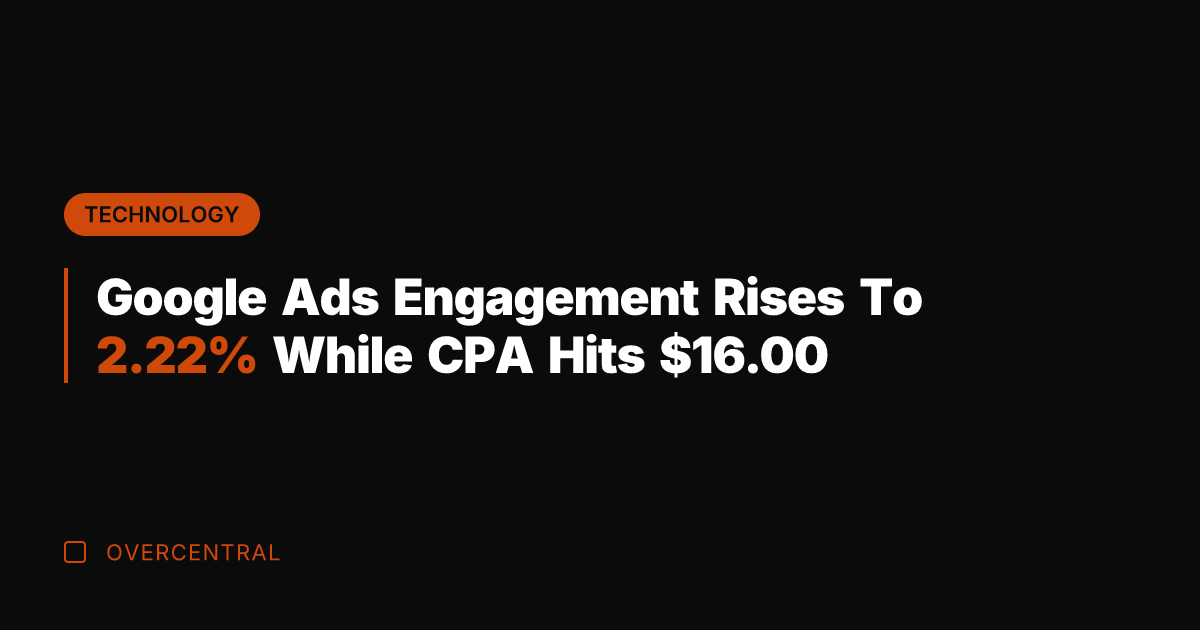
The data indicates a sustained rise in user engagement, with the platform-wide Click-Through Rate (CTR) climbing from 1.83% to 2.22%, a gain of 21.31% year-over-year. However, this increased CTR operates within a contracting impression pool, which fell by approximately 11%. The system is processing more clicks from a smaller, potentially more qualified set of available impressions.
This architectural shift creates a new performance profile: higher engagement does not directly translate to improved conversion efficiency. Conversion Rate (CVR) saw a marginal decline of 0.96%, while Cost Per Acquisition (CPA) increased by 4.41%. The technical interpretation is that AI-driven changes to the Search Engine Results Page (SERP) are weighting individual impressions more heavily, forcing advertisers to scale performance through broader query and intent coverage rather than simple impression volume.
| Metric | Year-Over-Year Change | Technical Implication |
|---|---|---|
| Click-Through Rate (CTR) | +21.31% (1.83% to 2.22%) | Increased user engagement per qualified impression. |
| Impressions | -11% (Approx.) | SERP density changes reducing total available inventory. |
| Conversion Rate (CVR) | -0.96% | Broader intent traffic converting at a marginally lower rate. |
| Cost Per Acquisition (CPA) | +4.41% | Higher competition for qualified clicks within the new impression pool. |
ROAS Performance by Account Scale: The $10K-$50K/Mo Sweet Spot
Budget scale acts as a defining variable in system performance. The dataset reveals a distinct efficiency peak within the mid-market segment, defined as accounts spending between $10,000 and $50,000 monthly. This segment achieved a Return on Ad Spend (ROAS) of 566%, roughly 50% higher than both smaller SMB and larger enterprise accounts.
Conversely, enterprise-scale accounts exhibited the highest CPA in the dataset at $16.00 and were the only segment where acquisition costs increased consistently across all five observed quarters. This divergence does not indicate poorer performance at scale but illustrates the system’s behavior as coverage expands. Growth at higher spend tiers is increasingly fueled by capturing ancillary demand beyond the core, most efficient conversion set, representing a natural dilution of top-line efficiency metrics.
Campaign Format Performance: Demand Gen, Performance Max, and Search
The migration of volume and conversions between campaign formats is a primary indicator of platform evolution. Demand Gen campaign volume surged 53.2% year-over-year, while traditional Video Action campaign volume declined by 31.6%. This is not a failure of video as a medium, but a strategic migration of conversion-focused budgets to the Demand Gen format, which offers superior long-term attribution across YouTube, Discover, and Gmail surfaces.

| Campaign Format | Volume Change (YoY) | Key Performance Shift |
|---|---|---|
| Demand Gen | +53.2% | Becoming the primary conversion engine for upper-funnel activity. |
| Performance Max | +15.7% | CTR up to 1.68%; tradeoff of higher reach for slightly elevated CPA. |
| Search | Slight Decline | Maintains peak CTR of 12.15%; acts as the closing engine for defined intent. |
The relationship between Performance Max and Search is becoming increasingly symbiotic. Performance Max functions as an upper-funnel net, capturing early and ill-defined user intent. Search then acts as the high-efficiency closing layer for users who return with clearer commercial intent. Growth is therefore a function of cross-campaign orchestration rather than isolated format optimization.
E-Commerce vs. Lead Gen: Divergent Conversion Pathways
Performance patterns bifurcate based on business model architecture. Lead generation accounts demonstrated efficiency gains, with ROAS improving from 248% to 267% alongside a 20% CTR growth, even with a slight CPA increase.
E-commerce accounts, however, show a different technical profile: a 23.87% CTR increase with flat Cost-Per-Click (CPC) drove more traffic at consistent cost, but Conversion Rate declined nearly 5% and ROAS dipped slightly. This pattern signals that e-commerce growth is increasingly reliant on multi-touchpoint journeys. Expanding into broader queries and placements brings more top-of-funnel traffic that requires subsequent nurturing through retargeting or search before converting.
Google Ads Attribution and The Multi-Touchpoint Reality
The core technical takeaway from the dataset is a fundamental shift in conversion attribution architecture. Platform-wide stability in ROAS and CPA masks a significant redistribution of conversion credit across an expanded touchpoint map. A single conversion event is now frequently the result of a user interacting with multiple campaign formats—a Demand Gen ad for discovery, a Shopping ad for consideration, and a Search ad for final conversion.
This multi-touchpoint reality necessitates a systemic change in performance analysis. Evaluating campaigns in isolation leads to a distorted view, where conversion rates may appear flat or CPAs may creep upward. The accurate diagnostic requires analyzing the contribution of each format within the holistic conversion pipeline. The tradeoff for broader reach and engagement is funding earlier-funnel interactions that do not convert immediately but are essential for capturing demand in the modern, extended user journey.